Thin structural plates with geometric discontinuities are indispensable in industries like automotive, aerospace, and maritime. Discontinuities such as holes, in various shapes and sizes, help reduce structural weight, create strong joints (bolted or riveted), and provide access to internal components, making them versatile and essential in modern engineering. But before they’re put to work, mechanical testing is critical to ensure they can handle stress and perform reliably under load.
In this post, we offer an overview of our Simulated Structural Parts Dataset (SimuStruct)—a free resource you can download today. SimuStruct includes 1,000 cases of 2D rectangular plates with holes, subjected to loads, along with von Mises stress measurements.
SimuStruct: A Dataset You Can Explore
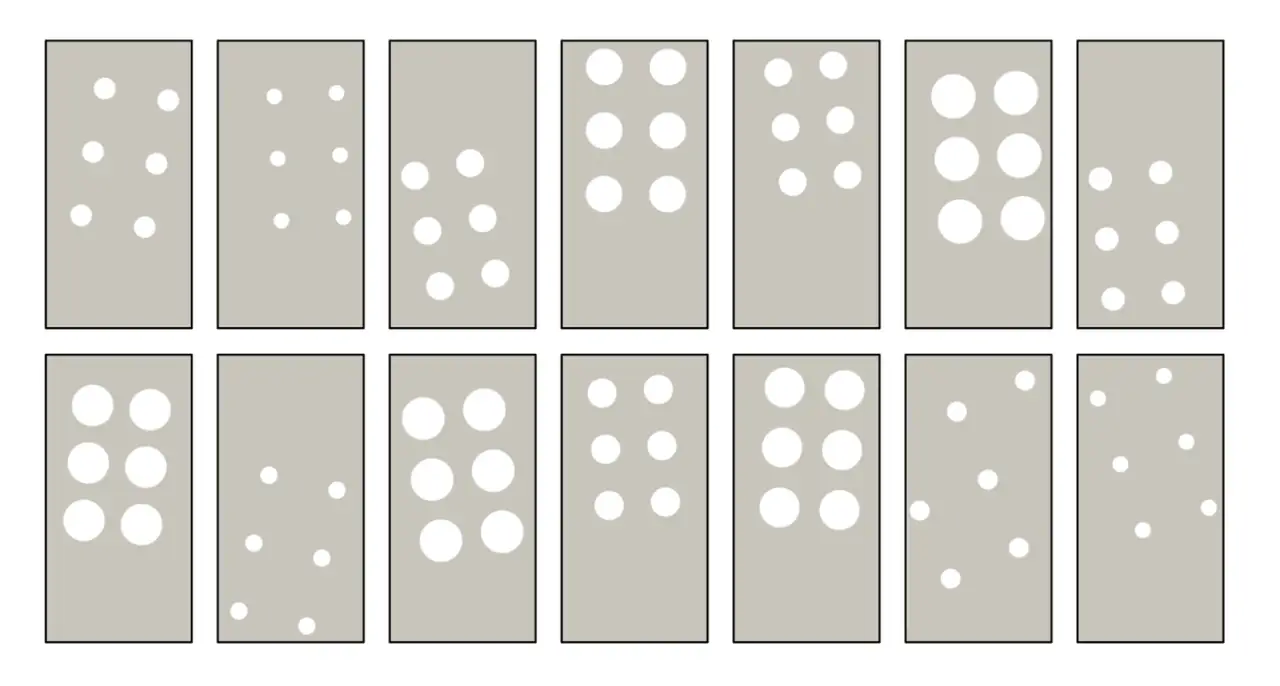
Each dataset sample features a rectangular plate with six circular holes arranged in a rectangular pattern. The size and positioning of the holes vary across samples. All plates are modeled with a steel alloy, exhibiting linear elastic behavior, characterized by a Young’s Modulus of $E=210$ GPa and a Poisson Ratio of $v=0.3$.
In every case within the dataset, the plates are supported along the bottom edge, fixed in the y-direction, and subjected to uniaxial loading at the top with a stress of $\sigma_1=100$ MPa. The von Mises stress measurements are simulated using the Finite Element Method (FEM), providing detailed insights into the structural behavior under load.
Figure 1 illustrates the setup used for this dataset, showing one of the plates under the applied loading conditions.

Each case in the dataset contains information about the plate geometry, i.e., characterization of the holes, the corresponding mesh data, and the von Mises stress for every point in the mesh, as illustrated in Figure 2.

To download the dataset, head to this link.
Dataset structure
Each dataset sample is stored in a folder labeled with its respective sample ID. Inside each folder, you’ll find four csv files detailing the plate’s geometry, mesh geometry and topology, and von Mises stress measurements, as illustrated in Figure 3.
File Breakdown and Contents Overview:
circular_holes.csv: This file provides data for the six holes in the plate. Each row corresponds to a hole, with the first two columns representing the x and y coordinates of the hole’s center, and the third column representing the hole’s radius. Since there are six holes, the array stored in this file has a shape of6 x 3.mesh_geometry.csv: This file contains the coordinates for each node in the mesh. The two columns represent the x and y coordinates, respectively. The array’s shape isnumber of nodes x 2, where each row corresponds to a node.mesh_topology.csv: This file provides information about the elements in the mesh. Each row represents an element and lists the IDs of the nodes that form it. Since only triangular elements are used, each element is defined by 3 nodes. The array’s shape isnumber of elements x 3.von_Mises_stress.csv: This file contains the von Mises stress values for each node in the mesh. The array has a shape ofnumber of nodes x 1, with each row corresponding to the stress value at a specific node.

Included with the dataset is a Jupyter notebook that provides the necessary steps to read and plot the SimuStruct dataset.
Ideas for Using the SimuStruct Dataset
This dataset offers several exciting applications across various fields, including:
- Machine Learning in Mechanical Engineering: Use the dataset to train machine learning models capable of predicting von Mises stress based on plate geometry and loading conditions. This could streamline structural analysis tasks in engineering projects.
- Material Science Research: Investigate how the presence and arrangement of holes affect stress distribution and the overall mechanical properties of a plate under uniaxial tension. This dataset provides valuable insights for material behavior studies.
- Design Optimization: Apply optimization techniques to discover the ideal configuration of circular holes that minimizes stress while maximizing performance. This can be particularly useful in lightweight structural design under specific loading conditions.
Acknowledgements
The authors would like to thank the collaboration of Dr. Faez Ahmed from Massachusetts Institute of Technology (MIT), Dr. Miguel A. Bessa from Brown University, Dr. Jorge Belinha from the Instituto Superior de Engenharia do Porto, and Dr. Sérgio M.O. Tavares from the University of Aveiro.
Cite our work
If you found this dataset useful, kindly cite our work:
@inproceedings{ribeiro2023simustruct,
title={SimuStruct: Simulated Structural Plate with Holes Dataset with Machine Learning Applications},
author={Bruno Alves Ribeiro and Jo{\~a}o Alves Ribeiro and Faez Ahmed and Hugo Penedones and Jorge Belinha and Lu{\'\i}s Sarmento and Miguel Anibal Bessa and S{\'e}rgio Tavares},
booktitle={Workshop on ''Machine Learning for Materials'' ICLR 2023},
year={2023},
url={https://openreview.net/forum?id=s3tOuyR1vM7}
}
🔩 Have fun! 🔩
If you have any doubts regarding the dataset, don’t hesitate to reach out at datasets@inductiva.ai! Also, if you’re using this data in your projects, we’d love to hear about it! We’ve got other cool datasets too, like our Fluid Cube dataset, which is also available to download.
Curious about creating your own synthetic datasets? Check out our own recipe for generating synthetic datasets to train physics-based ML models using Inductiva’s API!
Get started now and try our API for free.