Inductiva runs the simulations, so you can run the science.
System Metrics - Fit the Machine To Your Simulation
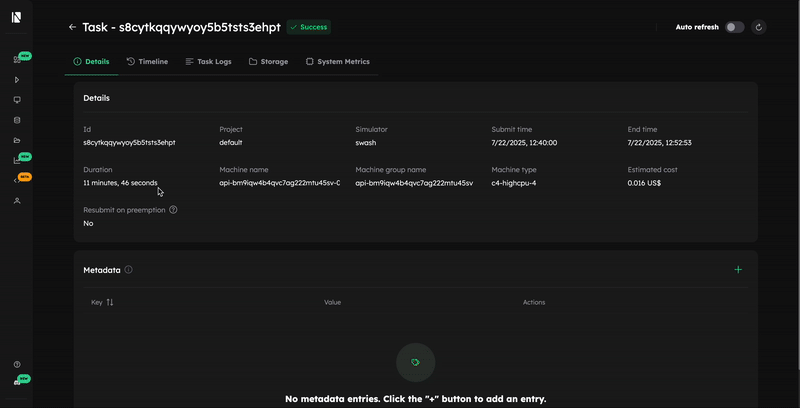
A section of the Task Detail screen - System Metrics - shows the key performance statistics for the machine that ran your task, including CPU and memory usage, plus total disk read and write.
⚠️ Please note that these metrics are not live; they become available only after your task finishes.
With System Metrics, you can better understand how your simulation used the computational resources, helping you fine-tune machine choices for faster runs and lower costs.
With the system metrics feature, you can gain valuable insights into your task's performance and efficiency, for example:
- Debug Performance Issues: Analyze the graphs to understand why a task was slow.
- A task constantly hitting 100% CPU usage is likely CPU-bound, so the user should consider running it on a machine with a higher number of vCPUs.
- A failed task whose RAM usage was very high might have failed due to lack of memory, so it could be worthwhile to try running it on a machine with a higher memory profile.
- A steady increase in memory usage might indicate a memory problem.
- Identify Resource Bottlenecks: Easily determine if your task's performance is being limited by CPU, memory, or disk I/O, allowing you to address the specific constraint.
- Optimize Resource Allocation: Make data-driven decisions for future runs. If a task only uses a small fraction of the allocated memory and CPU, you can select a smaller, more cost-effective machine next time.
For extra guidance, look into our guide to Pick The Right Cloud Machine For Your Simulation