Leverage the power of high-performance computing in minutes.
XBeach Visualizations with ParaView
This tutorial guides you through creating a visualization in ParaView using simulation results from XBeach.
As an example, we use the DELILAH field experiment, which is also featured in the official XBeach documentation.
Prerequisites
Download the necessary input files here.
Case Modifications
To automatically generate the XBeach visualization at the end of your DELILAH simulation, the following modifications were made to the params.txt input file:
outputformat = netcdf- ensures XBeach exports the results in NetCDF format.single_dir = 0- required for XBeach v10+; add this just after the header.- Global output block - provides the wave height (
H), free-surface level (zs), and bed level (zb) required by the visualization script.
nglobalvar = 3
H
zs
zb
tintg = 5- sets how often XBeach writes the global variables. A low value like5generates enough frames for smooth animation without producing excessively large files.
Running the DELILAH case
Below is the script to run the DELILAH case using the Inductiva API. The simulation is configured to export results in .vtk format using the export_vtk flag, making them compatible with ParaView for visualization. This example typically takes around 4 minutes on the specified cloud machine.
import inductiva

# Allocate cloud machine on Google Cloud Platform
cloud_machine = inductiva.resources.MachineGroup(
    provider="GCP",
    machine_type="c2d-highcpu-16",
    spot=True)

# Set simulation input directory
input_dir = "Path/to/Delilah_199010131000"

# Initialize the Simulator
xbeach = inductiva.simulators.XBeach()

# Run simulation
task = xbeach.run(
    input_dir=input_dir,
    on=cloud_machine,
    project="xbeach",
    export_vtk=True, # Flag to enable VTK output for visualization
)

# Wait for the simulation to finish and download the results
task.wait()
task.download_outputs()

cloud_machine.terminate()

task.print_summary()
At the end of the run, the simulation will be complete, and the results will be downloaded to the inductiva_output folder on your local machine.
Visualizing the Results with ParaView
When the export_vtk flag is set to True, a VTK folder will be created inside the inductiva_output directory. This folder contains two groups of VTK files:
seabed.vtk- a single, static mesh representing the seabed.wave_..vtk- a time series of .vtk files containing water-surface data at eachtintginterval.
Visualizing your simulation with ParaView is simple:
First, open ParaView and go to the menu File > Open.... Navigate to your
simulation results folder, then to VTK/, and select both Groups named seabed.vtk, and wave_..vtk.
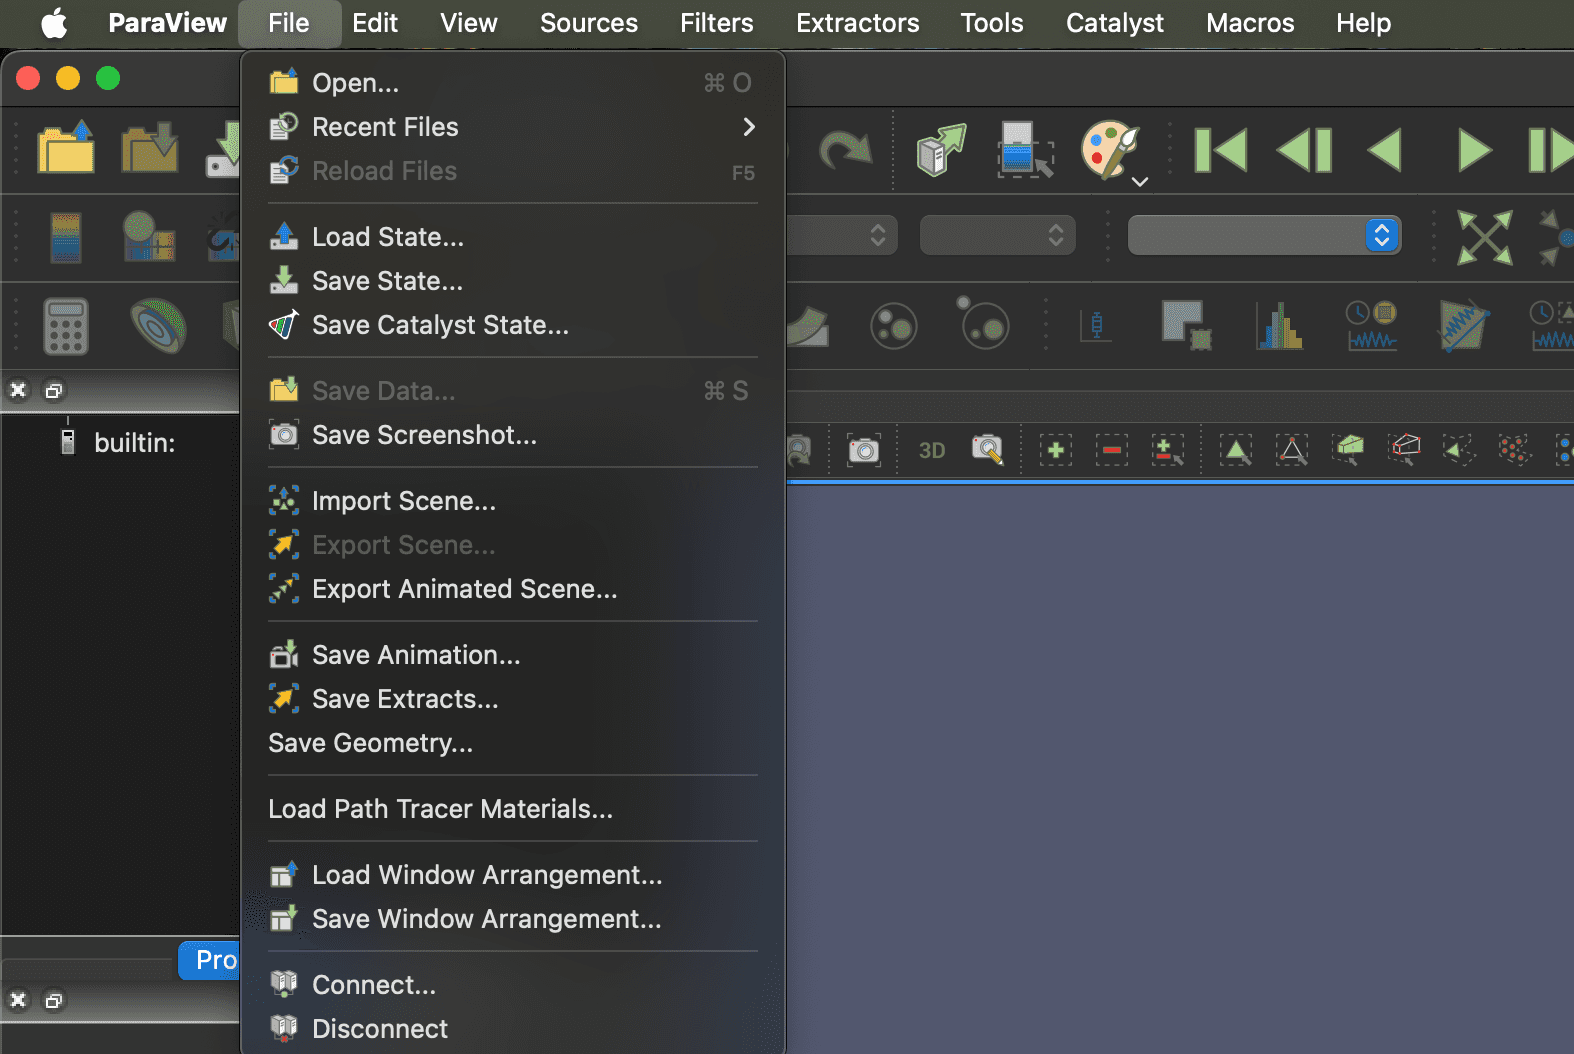
Figure 1: File -> Open
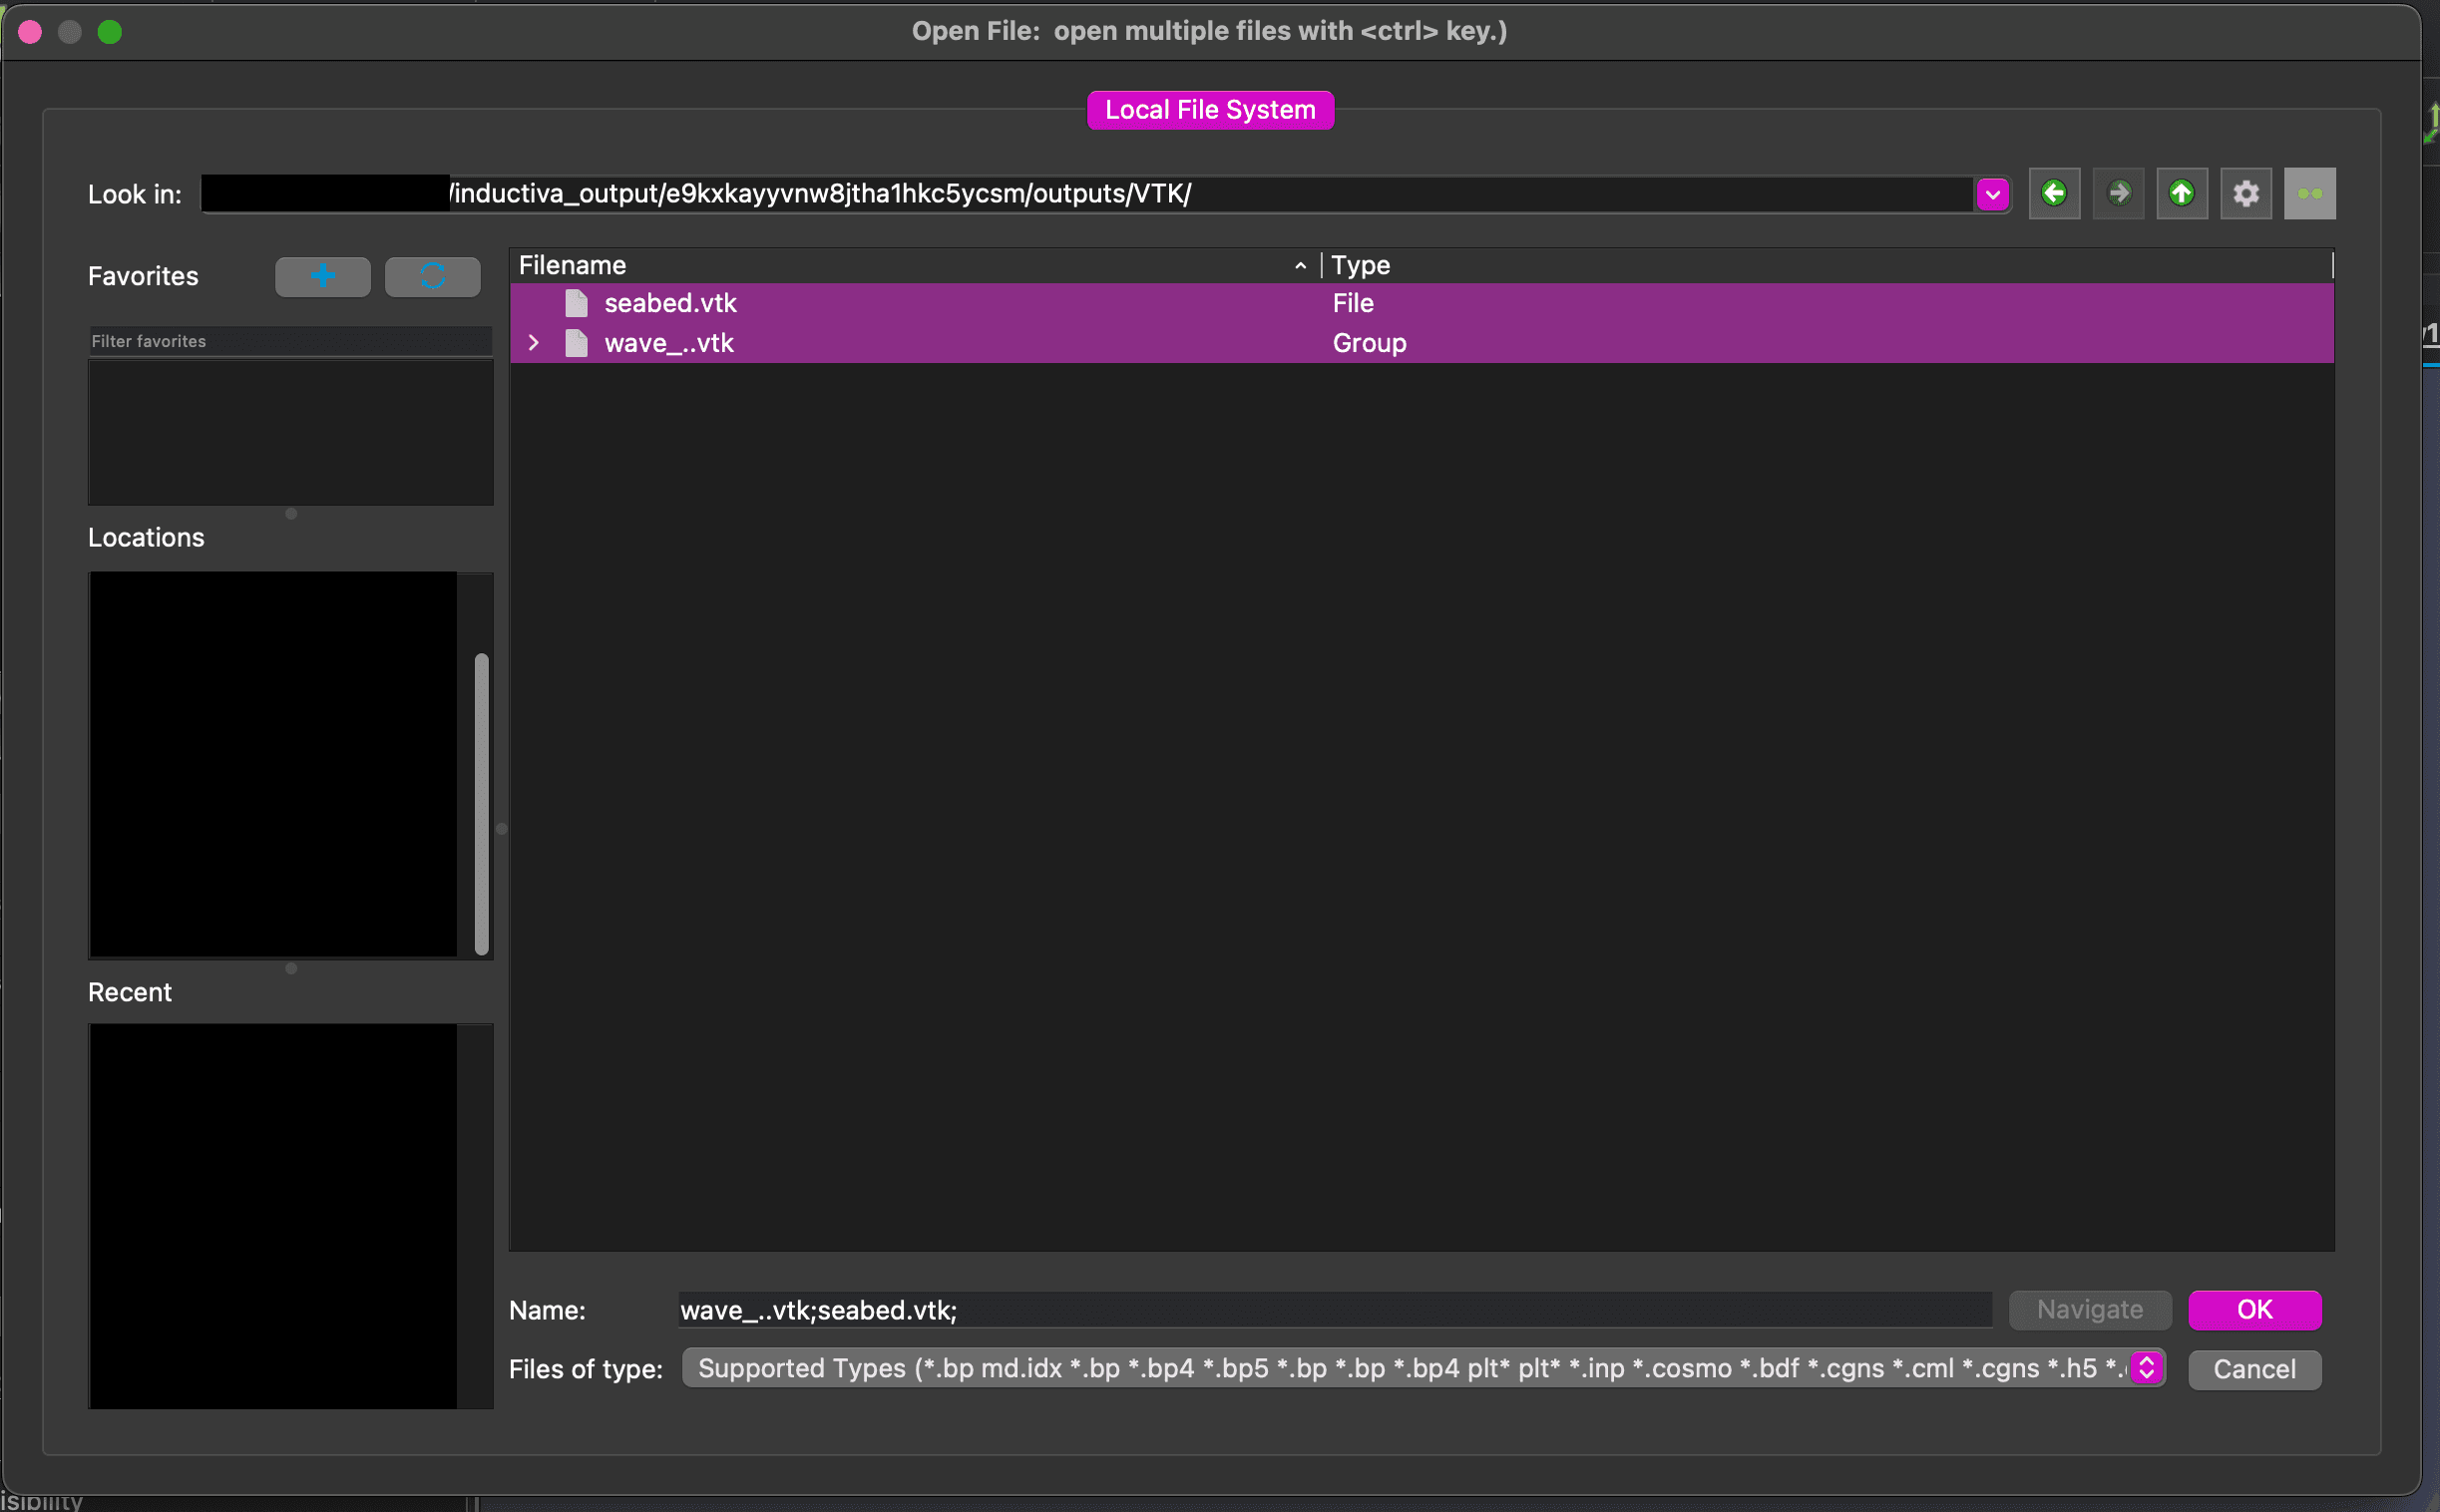
Figure 2: Selecting the files
Once all files are loaded, make them visible by clicking the eye icon in the Pipeline Browser on the left side of the screen.
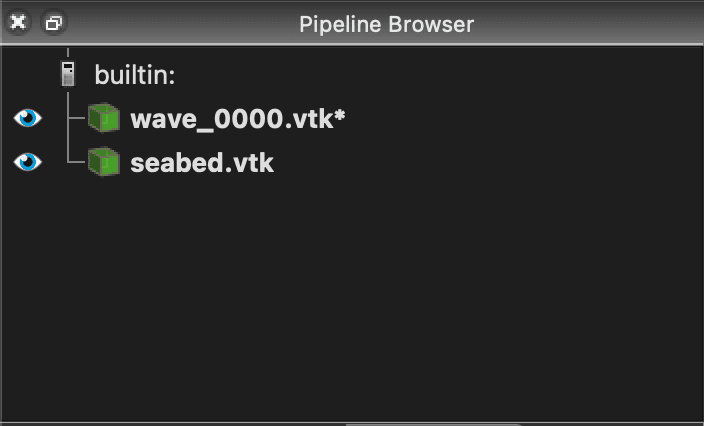
Figure 3: Make files visible
Next, position your camera by clicking the set view direction +X button in the toolbar.
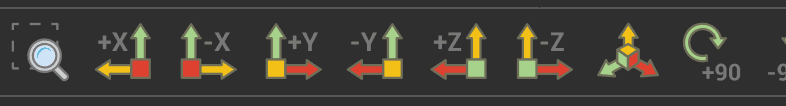
Figure 4: Move the camera to the correct position
Now you can press the Play button in the toolbar to watch your simulation run in real time.
Figure 5: Simulation running
You can save your animation by going to File > Save Animation... and choosing your preferred format.
That's it! You’ve completed the full workflow: from running an XBeach simulation using the DELILAH case to visualizing the results in ParaView.