Science moves fast. With Inductiva, so can you.
DualSPHysics Visualizations with ParaView
As an example, consider the 3D Dam Break tutorial.
By the end of that tutorial, your simulation will have completed, and the results will be downloaded to the inductiva_output folder on your local machine.
This guide will focus on creating a ParaView visualization from those simulation results.
Visualizing the Results with ParaView
Visualizing your simulation with ParaView is simple and straightforward.
First, open ParaView and go to the menu File > Open.... Navigate to your
simulation results folder, then to CaseDambreak3D_FSI_out/particles, and select the three Groups named PartFluid_..vtk, PartGate_..vtk and PartStructure_..vtk.
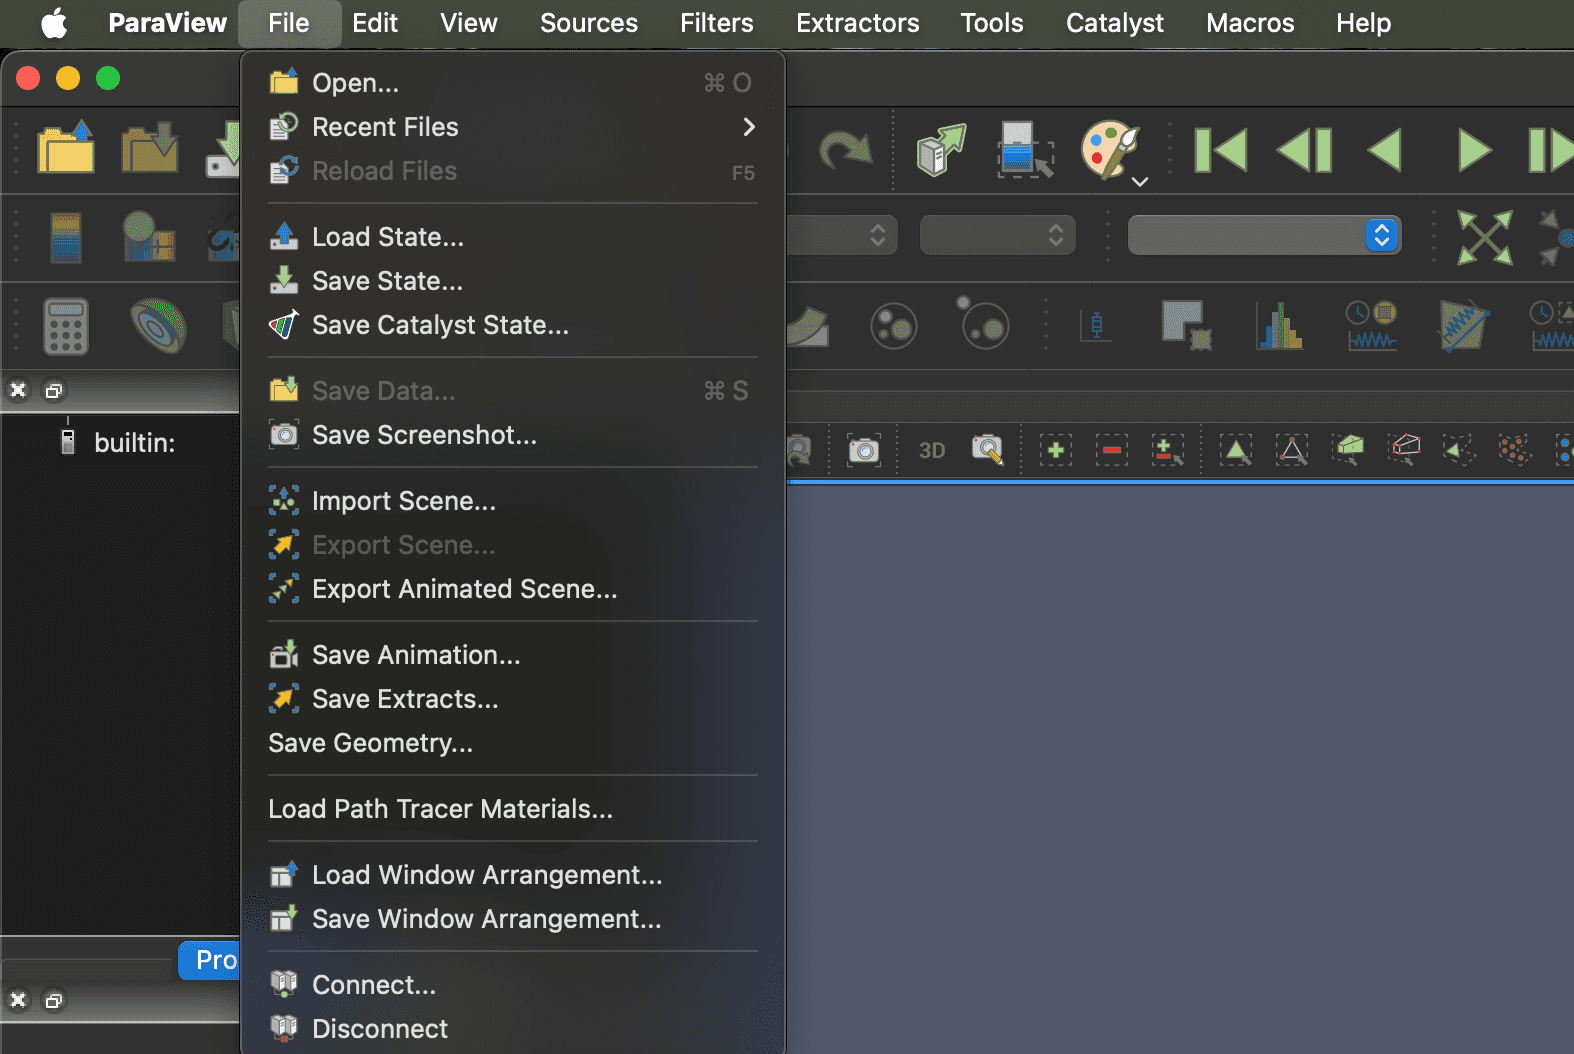
Figure 1: File -> Open
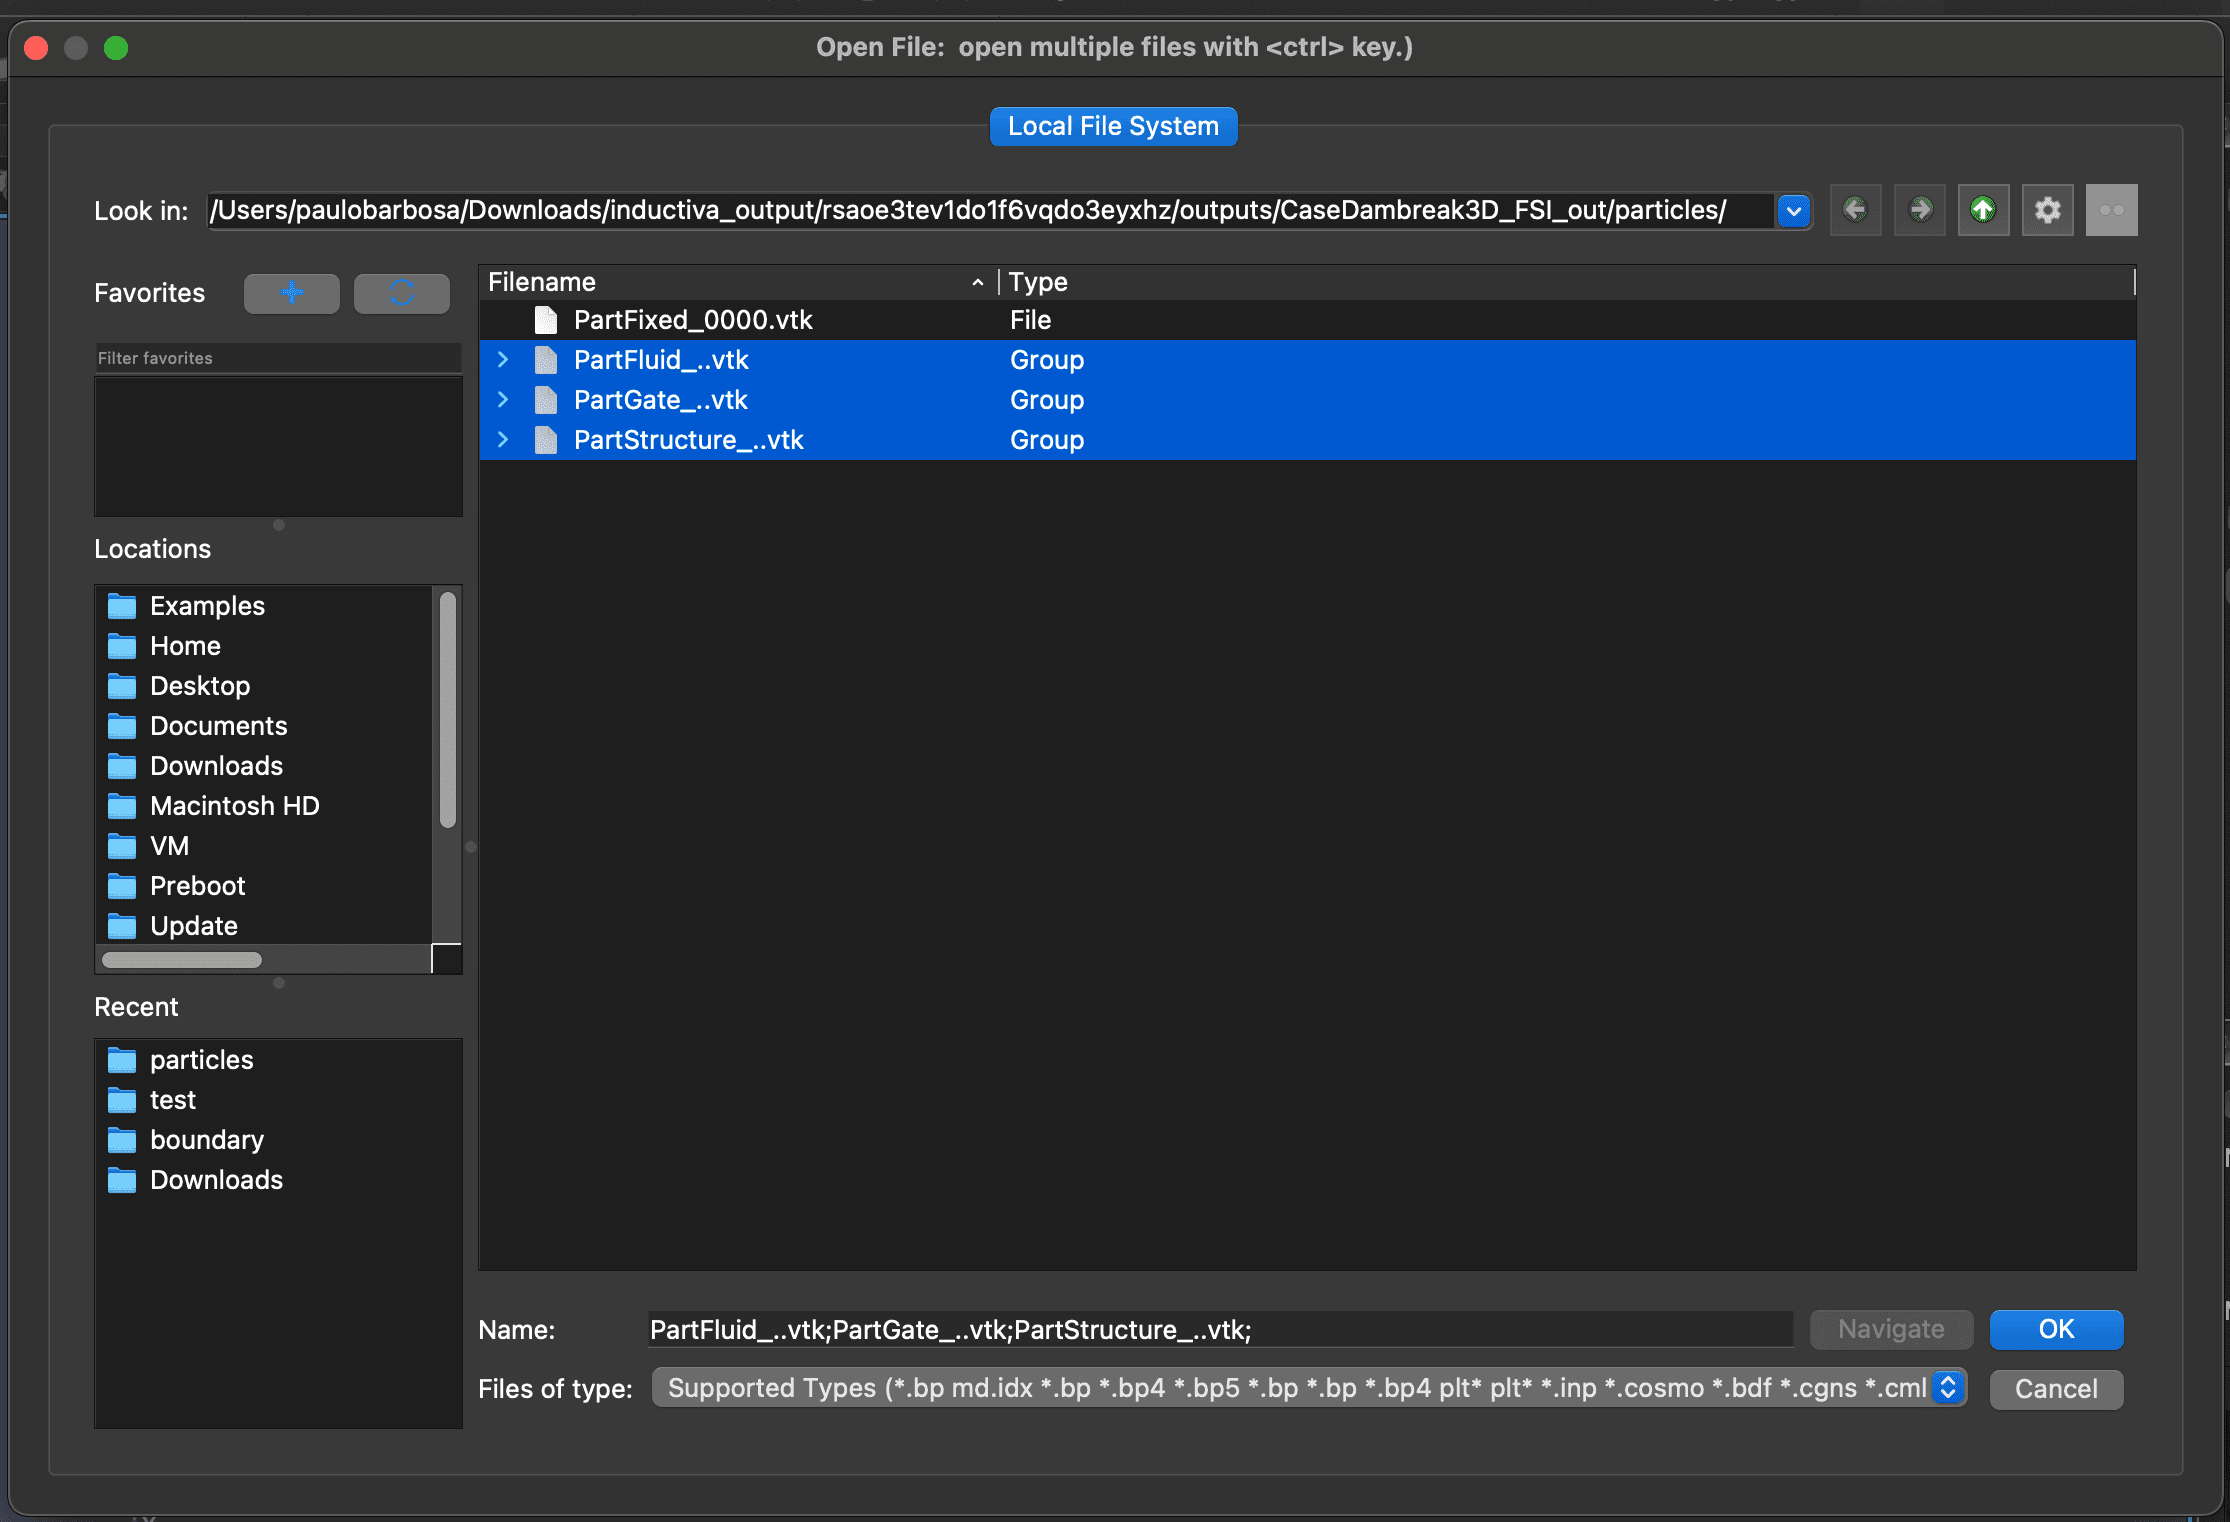
Figure 2: Selecting the files
Once all files are loaded, make them visible by clicking the eye icon in the Pipeline Browser on the left side of the screen.
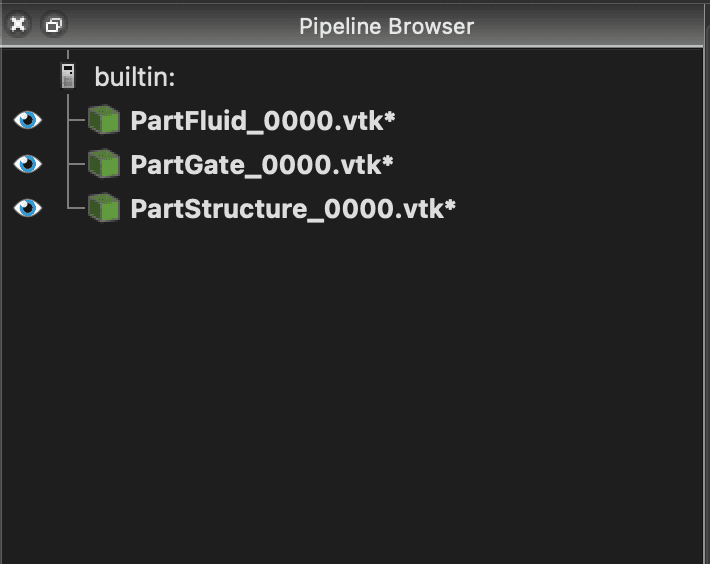
Figure 3: Make files visible
Next, position your camera by clicking the set view direction +Y button in the toolbar.
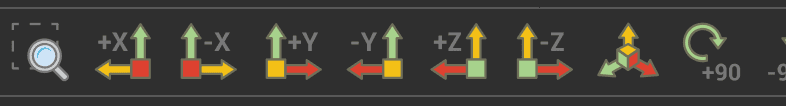
Figure 4: Move the camera to the correct position
Now you can press the Play button in the toolbar to watch your simulation run in real time.
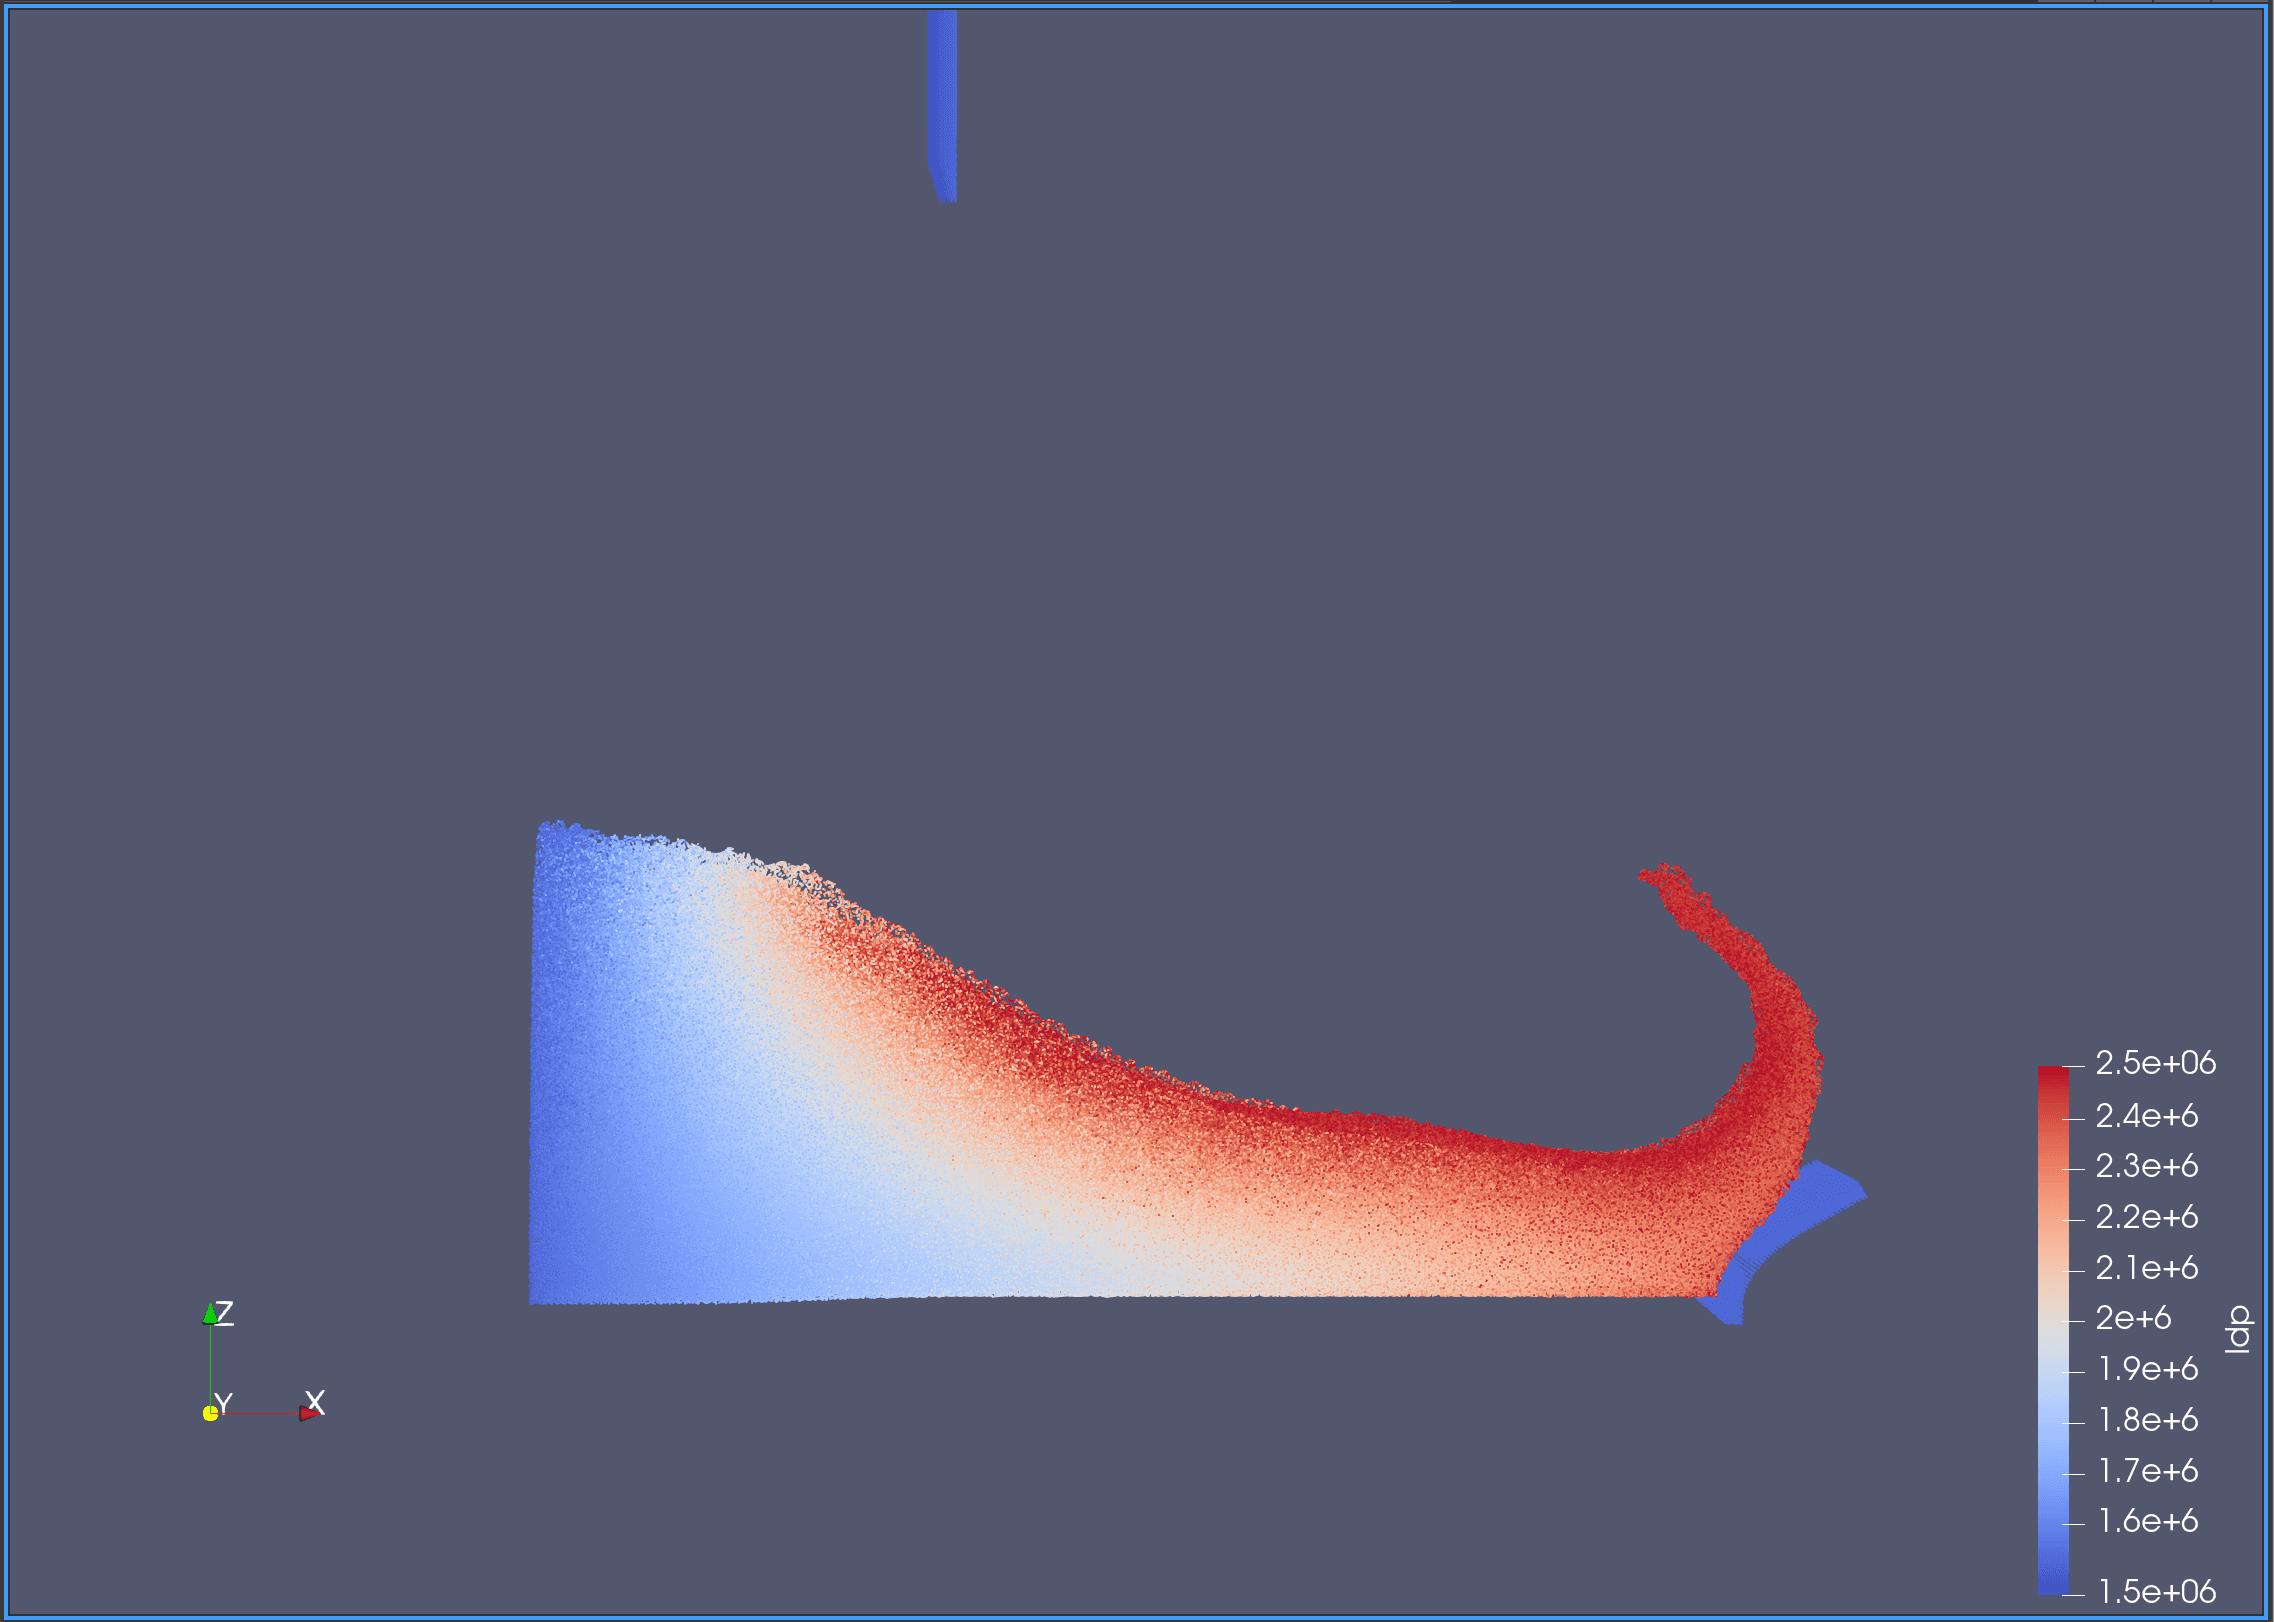
Figure 5: Simulation running
Choosing What Data to Visualize
In the previous section, we visualized the particles using ParaView’s default settings. A key part of analyzing your simulation is choosing which data to visualize. For example, DualSPHysics allows you to visualize particle velocity, depending on what data was saved during the simulation.
To do this, select PartFluid_0000.vtk* in the Pipeline Browser and change the dropdown menu above from idp to Vel.
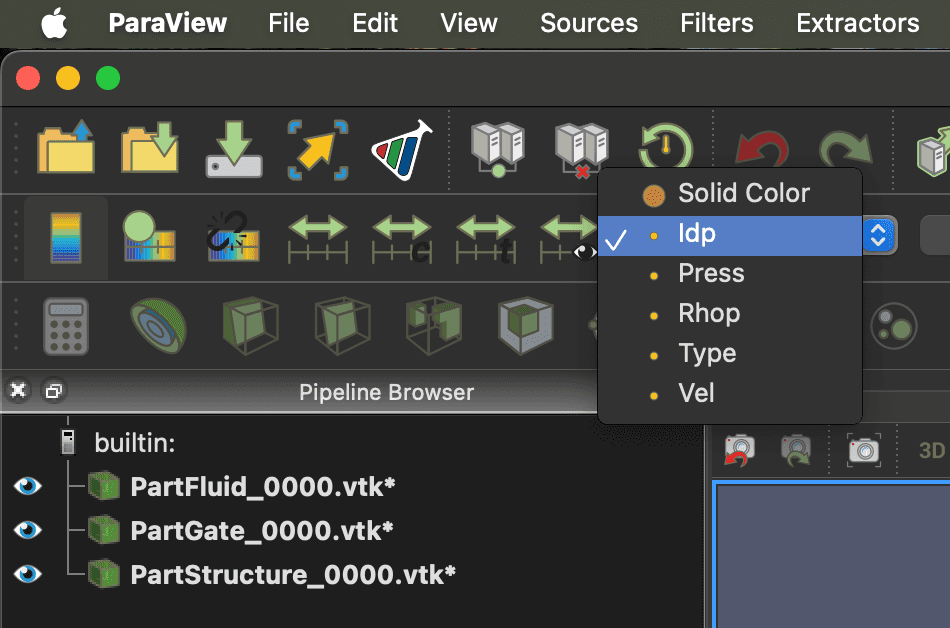
Figure 6: Changing idp to Vel
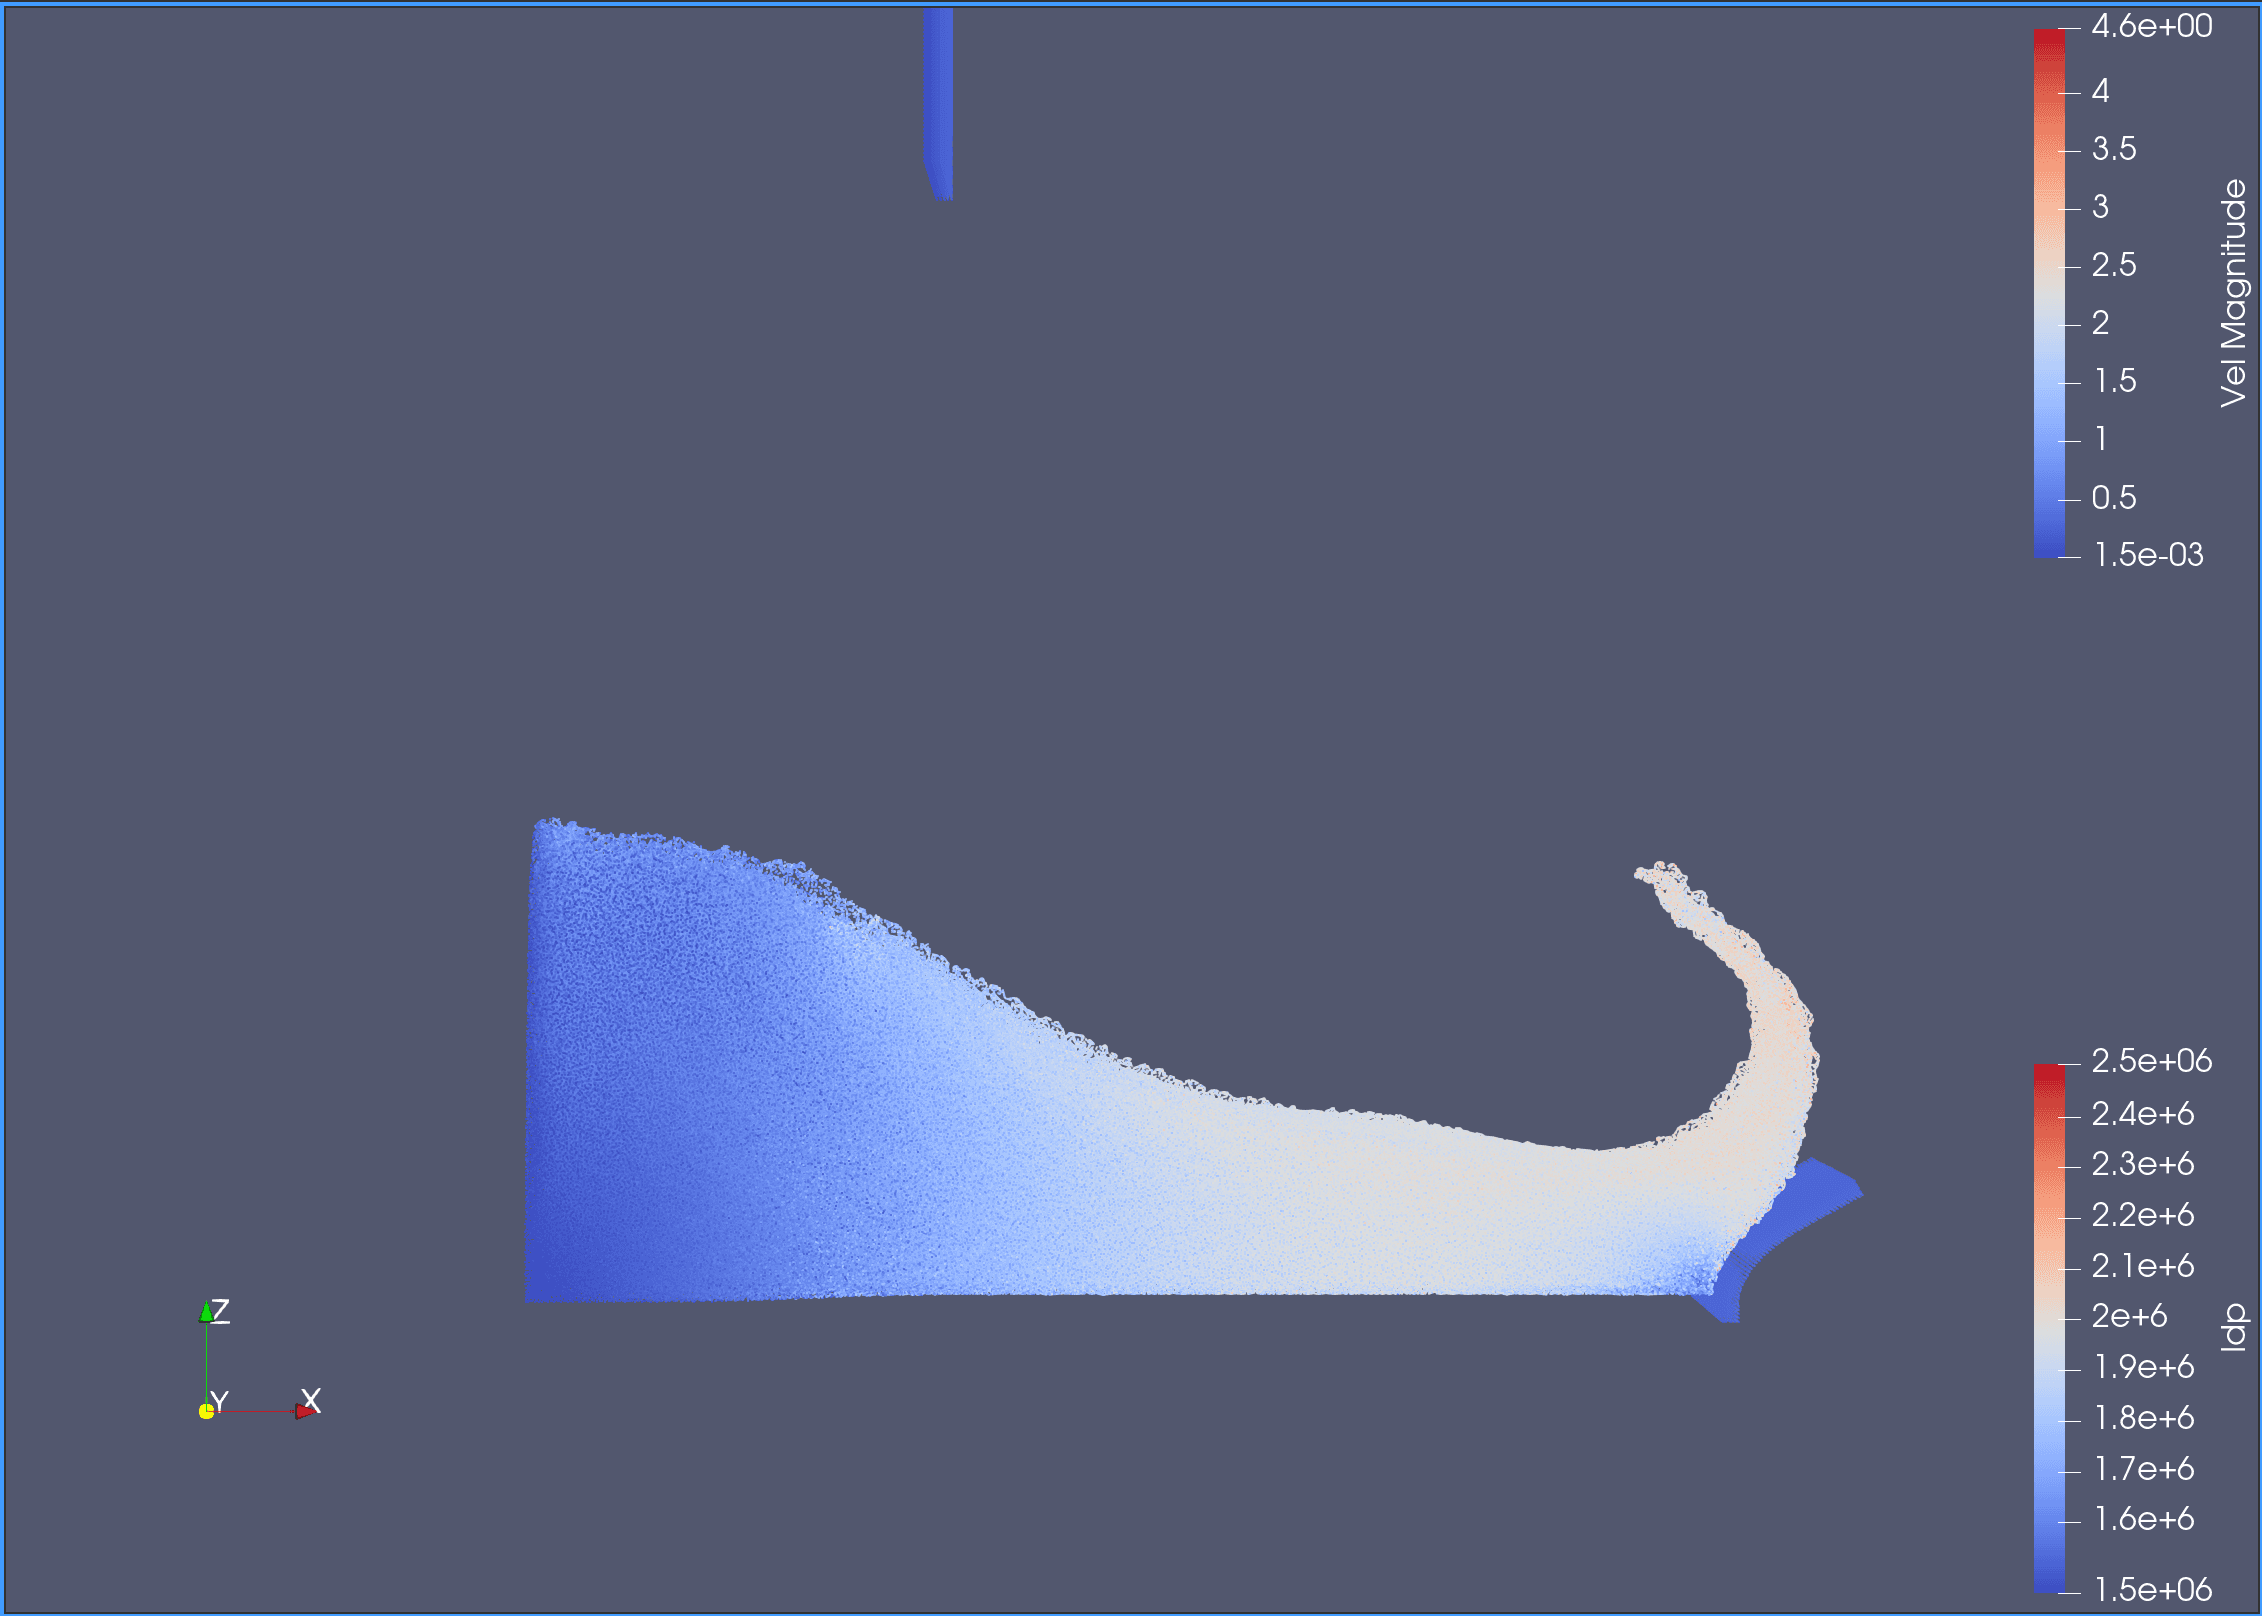
Figure 7: Simulation running with velocity visible
You can save your animation by going to File > Save Animation... and choosing your preferred format.